Changes are coming to RBWM’s ward boundaries which could see communities weakened, your voice drowned out and governance diluted further. Here’s Wisdom Da Costa’s latest stand to improve democracy for residents
As I previously reported in my blog, “Concerns about Council plans to redraw boundaries in Windsor – Blog“, RBWM is seeking to reduce the umber of councillors by 25% (14).
- A great cost saving measure I hear you say.
- Well actually no. On the basis that it might save a base cost of £112K (14 x £8K), compared to total allowances for 2016/17 (click link – it makes interesting reading) of £750K or, Gross Council of £260m, it might be a large price to pay for the large negative consequences
Large negative consequences
So what are the implications of the reduction in the number of councillors?
Put simply;
- Wards will not mark out your community, which they could have with some thought and desire
- Councillors covering more communities or bizarre areas are less likely to understand your needs and so less likely to be able to represent your needs effectively
- Independent Councillors who come from your area and understand you, are less likely to be elected so, you know who are likely to be elected
- Councillors will be overworked and so, less likely, if they are minded, to respond to your requests for help
- Councillors will have to do more, read more, try and understand more as the same amount of work gets divvied out amongst fewer people – in other words, work won’t get done and, potentially dangerous issues will be missed – most Councillors have daytime jobs to earn a living
- Overworked Councillors will be easier to control by central leadership, if off course they are minded to
- In short, governance of our Royal Borough is likely to further deteriorate
The consequences are not what I want for you and probably too high a price to pay for a £112K saving, hence my response (below) to improve democracy for residents
What did Cllr. Da Costa say on your behalf?
Here are the Summary Requests and the Executive Summary – you can click here to read my full 13 page submission, if you really want to.
[box]
Summary requests
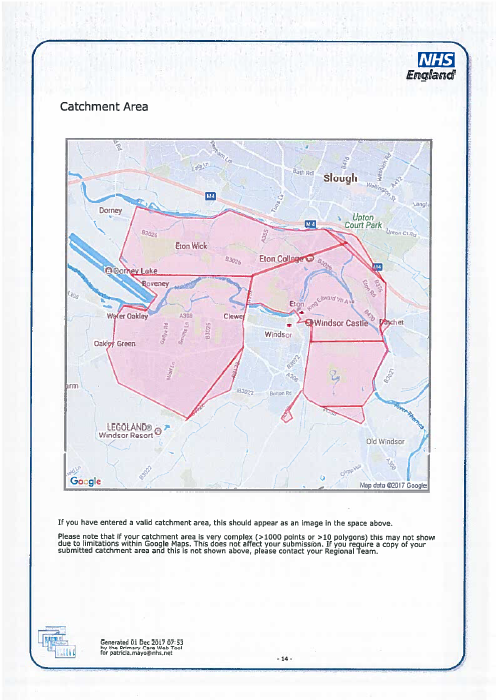
- Please amend the boundaries to help ensure interests and identities of local communities and, to facilitate effective and convenient local government. I suggest the 2 wards of
- Dedworth (4 members or 2 X 2 member wards of “Dedworth East” and “Dedworth West”) – more information below
- Clewer & St. Leonards (2 members) – more information below
- Amend the number of Councillors to at least 47 to help ensure the interests and identities of local communities are more fairly represented and, to facilitate effective and convenient local government though, this will still put scrutiny, and so services, at risk in an already deficient Borough and, create workload and service difficulties.
- Delay redrawing the ward boundaries until at least 2023 as the voter numbers are unreliable and will certainly create short term electoral inequalities and probably create significant long term inequalities and workload problems for Councillors.
[/box]
[color-box]
Executive Summary
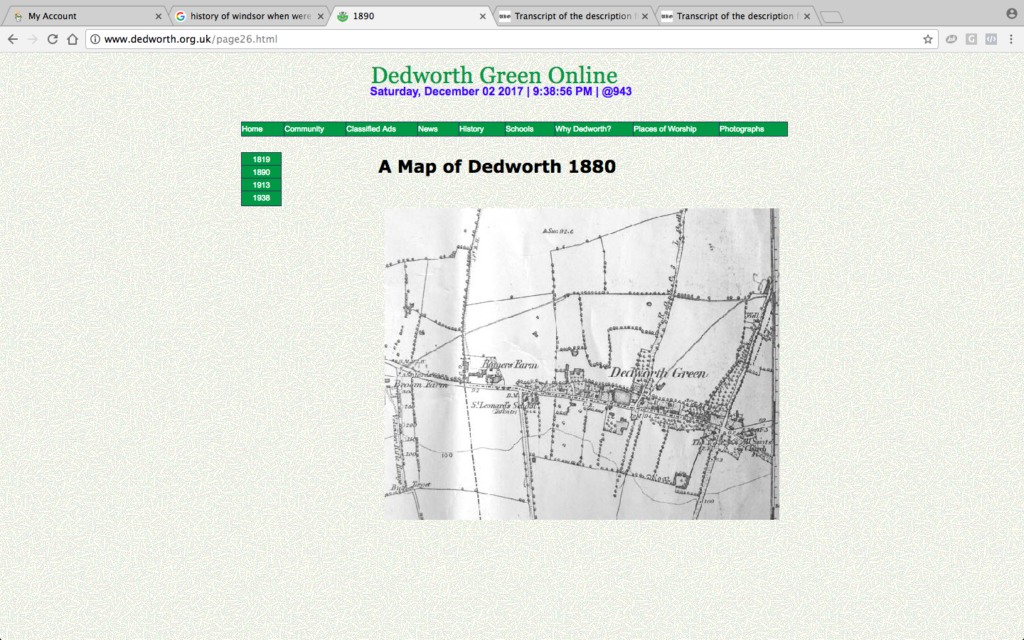
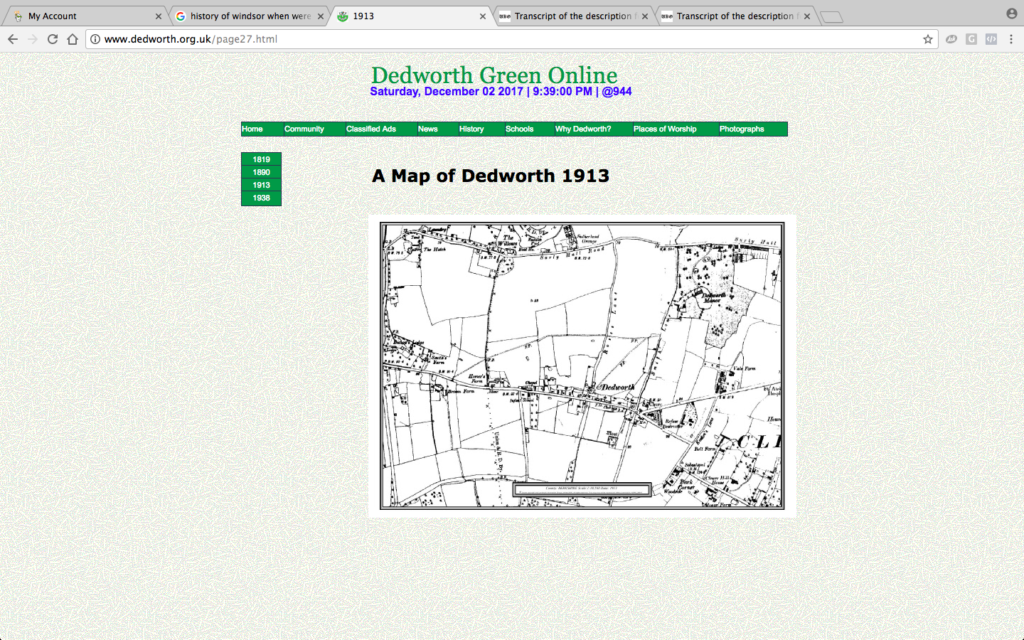
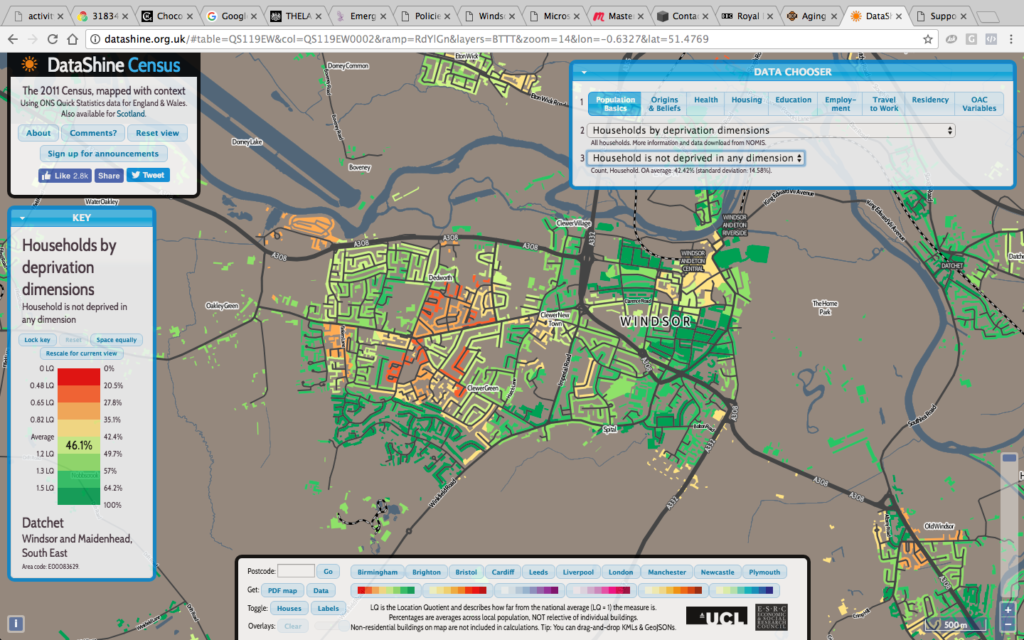
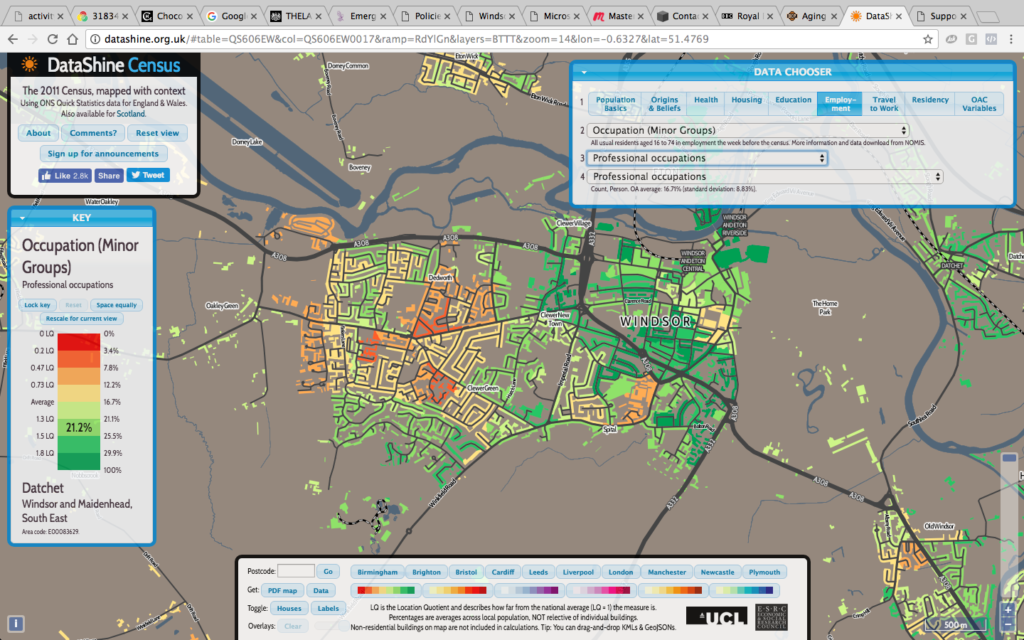
1. The more populated Dedworth is quite distinct from the wealthier Clewer; residents from each area each draw their social identity and ranges of services from separate facilities, mainly only sharing the Town Centre as common ground; their socio-economic descriptors also are distinctly different
2. Thus, based on the information, analysis and, my experiences representing people as a Councillor and I would propose two distinct areas with possibly the larger community being delineated and then split in two.
- Dedworth (4 member ward or, 2 X 2 member wards with “Dedworth East” and “Dedworth West”)
- Clewer & St. Leonards
3. It is important to maintain the number of members at at least 47 as reducing the number of Members, with or without the extreme challenges being faced, will
- Make the role of Councillor unsustainable, reducing scrutiny
- Will frustrate Localism and reduce the chance of ordinary residents standing as Councillors
- Create tensions in wards combining many distinctly different communities
- Reduce the chance of the fair representation of communities by party politicians who seem not to understand them
4. A 47 member Borough is likely to result in only minor variances in a single ward; this could be easily corrected by moving the boundary by one street
5. A 43 member Borough would create major variances and inequalities in most wards in Windsor which will negate the “interests and identities of local communities” and frustrate “effective and convenient local government”
6. Given that electoral numbers are likely to materially unreliable until 2023, the exercise should be abandoned and revisited after 2019
7. The principle of electoral equality can only be achieved if the figures for resident, and voter numbers, are accurate. However, there are many problems with the probity of the figures and, also the possible out turn.
8. I would suggest that;
- You delay the exercise until 2023
- Stipulate that a more thorough set of research be conducted by RBWM
9. Whatever their accuracy, the 2017 and 2019 figures presented will be substantially different from 2023 which will result in electoral inequalities at least between 2019 and 2023
10. If RBWM’s figures are correct then, electoral equality could be achieved with 47 Members i.e. a voter to member level of 2,275
11. To improve continuity of representation, and Effective and convenient local government, it might be beneficial to move from all out elections to elections by halves or thirds, as appropriate.
[/color-box]
Back up information
Here are extracts of some of the attachments and back up information to my submission


Windsor Schools – Pupils from Windsor Area
| Windsor | ||||||||||||
| School | Total Number On Roll | East Windsor | Eton | Windsor North | Windsor South | Windsor Villages | Windsor Total | Windsor % |
Windsor East & Villages % | Windsor North (DEDWORTH) % | Windsor South (DEDWORTH) % | (DEDWORTH) Windsor North & South % |
| Dedworth Green First School | 201 | 6 | 3 | 85 | 84 | 3 | 181 | 90.0% | 5.0% | 47.0% | 46.4% | 93.4% |
| Homer First School and Nursery | 247 | 10 | 1 | 122 | 86 | 4 | 223 | 90.3% | 6.3% | 54.7% | 38.6% | 93.3% |
| Hilltop First School | 255 | 15 | 1 | 64 | 108 | 4 | 192 | 75.3% | 9.9% | 33.3% | 56.3% | 89.6% |
| Alexander First School | 135 | 6 | 9 | 103 | 8 | 126 | 93.3% | 11.1% | 7.1% | 81.7% | 88.9% | |
| Clewer Green CE School | 285 | 40 | 2 | 57 | 161 | 6 | 266 | 93.3% | 17.3% | 21.4% | 60.5% | 82.0% |
| Dedworth Middle School | 462 | 23 | 30 | 133 | 216 | 24 | 426 | 92.2% | 11.0% | 31.2% | 50.7% | 81.9% |
| St Edward’s Catholic First School | 283 | 72 | 7 | 94 | 80 | 6 | 259 | 91.5% | 30.1% | 36.3% | 30.9% | 67.2% |
| Braywood C of E First School | 143 | 14 | 32 | 45 | 29 | 120 | 83.9% | 35.8% | 26.7% | 37.5% | 64.2% | |
| St Edward’s Royal Free Ecumenical Middle School | 475 | 146 | 15 | 123 | 141 | 7 | 432 | 90.9% | 35.4% | 28.5% | 32.6% | 61.1% |
| Windsor Girls’s School | 710 | 127 | 38 | 148 | 158 | 59 | 530 | 74.6% | 35.1% | 27.9% | 29.8% | 57.7% |
| The Windsor Boys’ School | 804 | 171 | 36 | 166 | 132 | 96 | 601 | 74.8% | 44.4% | 27.6% | 22.0% | 49.6% |
| Oakfield First School | 286 | 157 | 47 | 63 | 2 | 269 | 94.1% | 59.1% | 17.5% | 23.4% | 40.9% | |
| Trevelyan Middle School | 508 | 159 | 33 | 44 | 83 | 30 | 349 | 68.7% | 54.2% | 12.6% | 23.8% | 36.4% |
| Trinity St Stephen Church of England First School | 146 | 96 | 2 | 16 | 13 | 7 | 134 | 91.8% | 76.9% | 11.9% | 9.7% | 21.6% |
| The Queen Anne Royal Free CE First School | 144 | 116 | 1 | 8 | 15 | 1 | 141 | 97.9% | 83.0% | 5.7% | 10.6% | 16.3% |
| The Royal School (Crown Aided) | 99 | 6 | 3 | 4 | 3 | 41 | 57 | 57.6% | 82.5% | 7.0% | 5.3% | 12.3% |
| Eton Porny C of E First School | 124 | 7 | 36 | 3 | 2 | 1 | 49 | 39.5% | 16.3% | 6.1% | 4.1% | 10.2% |
| St Peter’s Church of England Middle School | 220 | 9 | 32 | 3 | 4 | 118 | 166 | 75.5% | 76.5% | 1.8% | 2.4% | 4.2% |
| Eton Wick C of E First School | 161 | 106 | 3 | 1 | 110 | 68.3% | 0.0% | 2.7% | 0.9% | 3.6% | ||
| Kings Court First School | 242 | 4 | 3 | 203 | 210 | 86.8% | 98.6% | 1.4% | 0.0% | 1.4% | ||
| 5,930 | 1,184 | 346 | 1,164 | 1,498 | 649 | 4,841 | ||||||
| Child Poverty UK | 3,300 | 68% | ||||||||||



I hope you found this useful and insightful.
Perhaps you agree with my points.
Let’s keep working together to put people first; justice and democracy for all.
Accountably yours,
Wisdom
WWRA Councillor, Wisdom Da Costa, Clewer North, Windsor
Caveat
This post is part of Cllr Wisdom Da Costa’s regular series of Blogs to inform and empower local residents; as he promised in his election leaflet
The views expressed in this article are not necessarily the views of the West Windsor Residents Association (WWRA).

